A Geological Evaluation of the vicinity of the Mid-Barataria Sediment Diversion
This evaluation was submitted as comments on the Draft Environmental Impact Statement for the Mid-Barataria Sediment Diversion. They propose that a thorough geological evaluation should be conducted at the site to determine the potential for sediment loading by the project to cause a major fault slip event.
These comments are being submitted on the Draft Restoration Plan and Environmental Impact Statement: Mid-Barataria Sediment Diversion (the “Draft EIS”). Comments submitted prior to drafting this Statement (McLindon et al, 2017) recommended: ”that a thorough subsurface geological evaluation of the vicinity of MBSD [Mid-Barataria Sediment Diversion] be conducted to attempt to determine the location of geological faults, the recent history of fault movement and the effects of active faults on subsidence rates and variations in the thickness of highly compactible soils.” This recommendation included evaluation including the use of oil and gas industry seismic data, the acquisition of high resolution seismic data, the acquisition of sediment cores, and the development of subsidence measuring capabilities. The Draft EIS concluded in response to this recommendation that “there is insufficient information on which to evaluate the impact of faulting on the proposed Project or the impact of the proposed Project on the future fault movement.” It was the intention of the McLindon et al (2017) recommendation to collect the information necessary to make such an evaluation.
The comments submitted here are in the form of a geological evaluation of the vicinity of the MBSD. There are two principal objectives to this evaluation:
1. To provide a framework within which to develop the ability to forecast a probabilistic distribution for the frequency and magnitude of fault slip events in the vicinity of MBSD and other large infrastructure projects on the coastal plain, and
2. To provide insights into the historical relationships between sediment loading, fault slip events, and fault-induced subsidence that may be incorporated into predictive models for land elevation and land area gain in the MBSD project area.
This evaluation has been constructed with the best available data, and is in no way intended to replace or substitute for the thorough geological evaluation recommended in McLindon et al (2017). The subsurface geological maps used here represent a compilation of geological interpretations over many decades. Inputs to the interpretation have included well logs, biostratigraphic data from micropaleontology, seismic data, gravity data, published subsurface geological interpretations from peer-reviewed technical literature and atlases constructed by the New Orleans and Lafayette Geological Societies, and interpretations submitted to the Louisiana Office of Conservation in support of oil and gas unitization
The Ironton fault
The Ironton fault is the most likely geological feature to have a direct impact on the MBSD Project.The fault plane has been mapped in the subsurface, and it is expressed on subsurface structural contour maps as a fault trace delineating the intersection of the fault plane and the mapped stratigraphic horizon.The fault can also be seen in cross sections constructed with oil and gas well logs, as well as 2-D and 3-D seismic data.Gagliano et al (2003) described this fault and other faults and salt domes in the area as being part of a “linked tectonic system”.This implies that individual elements within the system may be impacted by activity on other elements such as episodic fault slip events, diapiric salt movement (halokenesis), or salt dissolution.It also implies that faults within the system are likely to share similar characteristics.There is not adequate data available on the Ironton fault to derive the objective framework for modeling fault slip activity and its impacts, so data from other faults in the system and within the basin will be used here to construct the framework.

This evaluation will consider aspects of the ten faults labeled here to derive a set of characteristics that may be applied to the Ironton fault. Taken together this set of characteristics can be used to make reasonable estimates of a probabilistic distribution of the frequency and magnitude of episodic slip events on the Ironton fault. The map of surface fault traces shown in Fig.1 is a compilation of numerous individual interpretations including university theses and dissertations and peer-reviewed publications (Akintomide & Dawers (2019), Armstrong et al (2014), Bullock et al (2018), Culpepper et al (2019), Frank (2017), Johnston et al (2017), Levesh et al (2019), McLindon (2017)). A portion of this map is available in a GIS application on the Louisiana Department of Transportation and Development website.
A subsurface contour map of the Ironton fault plane is shown in Fig. 2 along with subsurface contours on the top of salt at the Lafitte and Lake Hermitage salt domes.A fault plane map is constructed by integrating the interpretation of biostratigraphy, well log correlation and seismic data.The values in blue in Fig. 2 are the depths at which the fault can be interpreted on a well log by the “missing section” in the log relative to surrounding well logs.A cross section of six well logs across the fault plane is shown in Fig. 3. Wells 2, 3


and 4 exhibit missing stratigraphic section due to the fault at depths of -2175, -9,195', and -10,512’ respectively. These values are integrated with those from other wells that intersect the fault plane along with seismic data interpretation to construct the fault plane map. The tops of the biostratigraphic intervals are shown as colored lines on the cross section. Each of these interval tops is correlated between the well logs and could be a potential mapping horizon. Mapped horizons at the top of the Pliocene and top of the Mid-Miocene Epoch are indicated on the cross section. The subsurface structure maps for these horizons are shown in Figs. 6 and 7, respectively. The vertical change in elevation across the fault, or fault throw, is shown for 5 horizons. The throw of the fault is 35’ and 840’ for the top of Pliocene and top of Mid-Miocene horizons respectively. These values could be measured from the cross section or by comparing the values of the subsurface elevation contours on either side of the fault on the subsurface structure maps. The throw of the fault continually increases with depth in the classic form of a Gulf Coast “growth fault”. Increasing throw with depth indicates that the fault has been continually, if episodically, moving throughout the geological timespan measured by biostratigraphic control.

The interval thickness between each horizon is shown for a well on the upthrown, or foot wall side of the fault, and one on the downthrown or hanging wall side. The ratio of the hanging wall thickness to the footwall thickness for any interval is called the “expansion index”, and it is used gain insight into historical fault movement. The deepest correlated interval is 485’ thick on the foot wall side and 704’ thick on the hanging wall side. The expansion index across the fault at this interval is 1.45, or the hanging wall side is 145% thicker than the foot wall side. The cross section also shows that the Ironton fault has a classic listric shape, which flattens with depth. The magnitude of the horizontal component of fault displacement increases with depth relative to the vertical component as the fault plane flattens. This illustrates the significant lateral movement that is associated with fault slip over time. It is likely that the horizontal vectors of movement measured at CORS stations in Fig. 33 are due to fault slip.
Fig. 4 is a portion of an oil and gas industry 2-D seismic profile across the Ironton fault. Seismic data can be integrated with subsurface well log interpretations in the construction of the fault plane map and subsurface structure maps within the interval of biostratigraphic control. It can also be used to map the fault plane and subsurface structure below this interval, allowing for the projection of fault plane contours to depths of up to 20,000 feet. Oil and gas industry seismic data is acquired and processed to optimize imaging of the subsurface between depths of about 2,000 and 15,000 feet below the surface, where most oil and gas is found. Seismic profiles such as that shown in Fig. 4 are less than optimal for imaging the near-surface extent of a fault, and interpretations generally have to be extrapolated to the surface. The acquisition of new high resolution seismic data across the Ironton fault recommended in McLindon et al (2017), and reiterated here, is intended provide the necessary imaging to evaluate the near-surface extent of the fault.

Fig. 5 is a graph of the variation of the expansion index across the Ironton fault through the span of geological time between the Mid-Miocene and Pliocene mapping horizons. The expansion index is generally above the value of 1 throughout most the time span indicating continual movement of the fault. As will be discussed in more detail in a subsequent section, the higher values of expansion index on the fault can be related to periods of increased sedimentary loading associated with an active delta system. Graphs like this can be used to assign a generalized relative quantitative value to the distribution of fault slip events over geologic time. It is likely that the history of fault movement has consisted of a distribution of individual events over time whose variation in magnitude is similar to other natural phenomenon such as earthquakes, floods and hurricanes. Unlike tectonic fault movement associated with earthquakes, the movement of listric faults in a passive margin setting is generally aseismic. The relative distribution of the magnitude of slip events over time may, however, be similar. In other words, fault slip on these faults may consist primarily of low magnitude slip events that manifest as a creeping motion on the fault, but larger events may occur sporadically over time. The primary intention of a thorough geological evaluation is to attempt to put ranges on the magnitude and frequency of slip events on the Ironton fault.

The Ironton fault plane is represented as a colored grid overlain on the subsurface structure map for the top of Mid-Miocene mapped horizon in Fig. 6. The subsurface trace of the fault is the brown polygon on the structure map based on the lateral component of displacement. Black squares indicate the down-dropped side of the fault. Well 3 from the cross section falls within the fault trace polygon for the Ironton fault on this horizon meaning that the horizon is “faulted out” of the well. It can be seen on the cross


section that the Mid-Miocene mapped horizon is not present in the well, as it has been displaced vertically and laterally by the fault. A comparison of the Mid-Miocene map in Fig. 6 and the Pliocene map in Fig. 7 shows how the trace of the fault on the map reflects the decrease in throw with depth. Subsurface geological structures generally become simpler and flatter at shallower depths. At the depth of the Pliocene mapped horizon only the major faults are still active. These are the same faults that appear to reach the surface. The 0’-depth contour of the Ironton fault plane is coincident with the surface trace of the fault shown in Fig. 1. The most significant impacts of a potential future fault slip event should be expected along this trace, and future geological evaluation of the fault should be focused on more fully delineating the near-surface fault plane with high resolution seismic and sediment cores. Fig.8 also shows the connection of the Ironton fault plane to the Lafitte and Lake Hermitage salt domes. These are elements of the linked tectonic system described by Gagliano et al (2003). There is likely to be a genetic relationship between the structural evolution of the fault and the salt domes. It is probable that halokentic salt movement on the domes has affected the history of movement on the fault. It is also possible that the dissolution of salt at the domes may have contributed to triggering fault slip events. Halokenesis and salt dissolution should be considered as potential causes for future slip events on the Ironton fault.
A near-surface expression of the Ironton fault can be seen in a profile of cone penetrometer tests (CPT) taken along the proposed conveyance structure for the MBSD. Interpreted images of a profile including the same tests were published in the Geotechnical Baseline Report for 30% Design (CPRA, 2014). These interpreted images indicated the correlation of the top of the Pleistocene interval with an overlying deposit of “Near Shore Gulf” sand shown in orange in Fig. 9. This sand layer is likely to represent a basal Holocene transgressive unit associated with the first submergence of the Pleistocene surface by rising sea level.


Frazier (1967) interpreted borings taken along the Barataria Waterway, and defined the top of deposits associated with the Bayou Families Delta at between 30 and 40 feet below the surface in this area. The sandy, silty layer in this depth range on Fig. 9 is likely to be associated with this delta lobe. These approximate ages may be used to generally approximate rates of fault slip on the Ironton fault, however much more accurate age determinations from sediment cores used in association with high resolution seismic profiles would be necessary to provide estimates accurate enough to be used in predictive modeling.
Fig. 9 indicates 6 feet of throw on the Ironton fault at the top of the Pleistocene surface. If the more detailed geological evaluation recommended here supports this interpretation, it may concluded that the 6 feet of throw is consistent with the pattern of throw versus depth seen on the cross section in Fig. 3. It is likely that the magnitude of this throw is the result of the cumulative effect of multiple fault slip events that have occurred since the deposition of the basal transgressive sand. Fig. 10 shows the fault plane contours of the Ironton fault crossing the CPT profile at the interpreted location of the fault on the profile. Oil and gas wells in the area are identified by their Louisiana DNR serial number, and the depth of the Ironton fault is indicated in blue.
Characteristics of other faults in the area
Each of the nine other faults shown in Fig. 1 will be considered here to provide a collective characterization that may be used as a framework within which to develop the ability to forecast a probabilistic distribution for the frequency and magnitude of fault slip events on the Ironton fault. Each of these faults exhibits some indication of recent fault movement. Some reveal the potential impacts of faults on infrastructure, and some document differential rates of Holocene sediment accumulation across the fault.

The Vacherie fault (Fig. 11) provides the highest quality data point for the magnitude of a recent individual fault slip event. The event occurred between April 12th and 15th, 1943, and the magnitude of the vertical displacement was reported by Fisk (1944) to be 8 inches. There was some reported local ground shaking, but there was no detection of seismic activity at the Loyola University seismometer only 50 miles away. This appears to have been an aseismic fault slip event. Fisk used a boring profile across the fault escarpment to measure 3 feet of vertical displacement across the fault at the top of the Pleistocene. He interpreted this to indicate recurrent movement on the fault. Fisk also noted “Of particular interest is the fact that faulting occurred at a place along the river where repeated crevassing took place.”
It is probable that the 3 feet of displacement at the top of the Pleistocene is representative of the cumulative total of all of the recurrent fault slip events throughout the Holocene. If each recurring event produced a displacement of 8 inches, then there could have been three previous events over the 7,000 year span that is likely to be represented by the Holocene sediments. Some of the displacement could have been taken up by compaction of the poorly consolidated sediments, which may allow for more events of the same magnitude, but it may also be true that larger magnitude events in the past would have been necessary to cause a crevasse of the river. If the history of movement on the Vacherie fault could be accurately reconstructed, it would likely show a log-normal distribution in the magnitude of the fault slip events. Subsurface mapping indicates that the fault has been active since at least the early Miocene. Movement since the deposition of the first Holocene sediments would probably be represented by many small slip events that would have propagated a creeping movement on the fault, and a few large events, perhaps with magnitudes of a foot or more vertical displacement adequate to cause a crevasse of the river.
The correlation of the fault and the site of the historical crevasses of the river is significant. The 1943 fault slip event occurred during flood stage on the river. It is likely that the dilation of near-surface aquifers near the river channel during flood stages may alter the stress fields within the near surface sedimentary layers, and provide a potential trigger mechanism for fault slip events. The 6 feet of vertical displacement at the top of the Pleistocene seen on the CPT profile in Fig. 9 is twice the value seen on the Vacherie fault. This may suggest that the Ironton fault has had more and higher magnitude fault slip events during the Holocene. There is no evidence of historical crevasses of the river at the Ironton fault, but some effort should be made to evaluate the magnitude of an event that would be necessary to cause a crevasse of the river, and the probability that such an event could occur using predictive modeling based on a likely distribution of the magnitude of historical events. This is particularly true given that differential sedimentary loading across the fault, as intended by the MBSD project, may provide a trigger mechanism for a fault slip event.

The Highway 11 fault (Fig. 12) provides the most tangible evidence for the impact of a fault on infrastructure in the area. The fault also provides valuable insights because it is the single place in south Louisiana where a fault is crossed by a high resolution seismic line capable of measuring near-surface fault throw on multiple horizons (Lopez et al, 1997). Vertical displacement on the fault at the surface has also been measured by elevation surveys across the Highway 11 Bridge (Hopkins et al, 2016).
The seismic profile across the fault exhibits high-quality imaging of Pleistocene sedimentary layers to a depth of about 150 feet with a vertical resolution of less than a few feet. This type of imaging capability is necessary to evaluate faults in the near-surface, and is recommended for a geological evaluation of the MBSD project area. Lopez et al (1997) provided interpreted correlation of seismic horizons associated with sedimentary layers across the fault. The fault exhibits increasing throw with depth and thickening of stratigraphic intervals on the hanging wall side up to the surface. It is likely that this pattern extends to all faults delineated on Fig. 1, and it suggests continual episodic movement on the faults throughout the Quaternary. If this seismic profile had been combined with high resolution dating of sediment cores, it would have been possible to reconstruct a detailed history of fault movement. A reconstruction of fault movement from this type of data is likely to reveal averaged movement over intervals of time rather than individual episodic fault slip events, but it would be valuable for putting reasonable ranges on the magnitudes of individual events within a given interval.
The elevation profiles from Hopkins et al (2016) indicate the magnitude and span of displacement across the fault, and valuable estimates of average rates of fault slip. The lower of the two elevation profiles in Fig. 12 shows the entire span of the Highway 11 Bridge. It is important to note that while there is a localized increase in offset immediately adjacent to the fault, the entire hanging wall side of the fault has a lower elevation than the footwall side. This indicates that subsidence due to cumulative fault slip has affected an area of up to 100 square miles or more. The average rate of subsidence associated with fault slip is between 1.3 and 3.0 mm year over the time span measured. This is likely to be the result of cumulative slow slip movement, as there have been no reported episodic events on the fault over the past few decades. Lopez et al (1997) did however document the occurrence of two small earthquakes associated with the South Point fault near the end of the bridge in 1987.
The St. Rose fault (Fig. 13) also appears to exhibit the impact of faults on infrastructure. The surface trace of the fault is clearly delineated by a sharp tree line in the cypress swamp. Trees on the hanging wall side of the fault have mostly died. The plane of the fault can be mapped in the subsurface with well log correlation and 3-D seismic data interpretation. One possible explanation for the death of the trees is the migration of saline fluids to the surface along the fault plane. A similar configuration exists at the Montegut fault (Fig. 16) where Kuecher et al (2001) measured a distinct anomaly in total dissolved solids in soils adjacent to the fault. Saline fluid migration has also been documented on faults in the Baton Rouge fault system.
The clearly defined surface trace of the St. Rose fault very closely coincides with two apparent impacts on infrastructure. An elevation survey on Highway 626 shows a vertical offset on the road bed. The trace of the fault also coincides with a crack and vertical offset in a T-wall in the St. Rose drainage structure.

The Gentilly fault (Fig. 14) was identified in a boring profile by Fisk (1944). The vertical offset at the top of the Pleistocene (blue on the profile) is nearly 20 feet. As a result, the Holocene sediments, and in particular the organic clay and peat deposits near the surface are thicker on the hanging wall side of the fault than they are on the foot wall side. A map of peat thickness across the area by Gould and Morgan (1962) shows that

the thickest accumulation of peat in the area is on the hanging wall side of the fault.
Zou et al (2015) used US Coast and Geodetic Survey data from repeat surveys of elevation benchmarks in the area to delineate a high subsidence anomaly that coincides the thick accumulation of peat on the hanging wall side of the Gentilly fault. This is likely to be a result of a feedback loop between fault slip and sediment accumulation. Subsidence rates are logically higher across an area of thick peat accumulation because sedimentary layers composed primarily of poorly consolidated organic material are likely to exhibit higher rates of compaction resulting in subsidence expressed at the surface. A consideration of why the peat layer is thick in the first place would lead to the recognition that peat accumulation is itself a response to subsidence. The accumulation of peat has both a cause and effect relationship with subsidence in the area. Marsh and swamp ecosystems on a delta plain maintain elevation through organic growth with some input of mineral sediment from river flooding or tidal flux. As plants in the ecosystem die and are submerged new plants grow on top of them. The rate of the accumulation of organic material is controlled by the rate of subsidence. Areas with the high subsidence rates, such as the hanging walls of faults, tend to have thicker peat accumulations.
The total vertical displacement of 20 feet at the top of the Pleistocene suggests that the Gentilly fault has had higher magnitude and possibly more frequent individual slip events than either the Vacherie or Ironton faults. Possible ranges for values of a distribution of magnitude and/or frequency of fault slip events can be considered. If a distinct fault slip event occurred an average of once a century over the 7,000 year span representing the accumulated Holocene sediments, then there would have been 70 individual slip events and the average magnitude of each event would have been about 3.4 inches of vertical displacement. If distinct slip events occurred once a decade, then there would have been 700 events with an average magnitude of about 1/3 inch. Given the size distribution patterns of other natural phenomenon like earthquakes, floods and hurricanes, it is more likely that fault slip events have not occurred at evenly spaced intervals of time with equal magnitudes. It is more likely that the historical distribution the magnitude of slip events on the Gentilly fault exhibits a log-normal pattern, and that high-end magnitudes with less than a 1% chance of occurrence may have values of 2 feet or greater, while low-end magnitudes may be fractions of an inch. The cumulative effect of all of the individual fault slip events since the beginning of Holocene deposition accounts for the 20 feet of vertical offset at the top of the Pleistocene.
The Central Wetlands Unit, which overlies the thick peat accumulation on the hanging wall side of the Gentilly fault is recognized as a hot spot of wetlands loss. It is likely that subsidence associated with fault slip and differential compaction of the peat layer across the fault has contributed significantly to the submergence of the wetlands. The magnitude of the rate of subsidence is evidenced by the submergence of Old Paris Road, which as constructed in the 1930s, and is now 2 feet below the water’s surface. This is an obvious impact on infrastructure. It also appears likely that the surface trace of the Gentilly fault can be extrapolated to connect with a fault segment documented by Dokka (2011). He used a LIDAR digital elevation model to reveal the escarpment of a fault crossing Gentilly Blvd. in eastern New Orleans. Dokka also documented shear and extension fractures in the streets that coincided with the location of the fault.

The Barataria fault (Fig 15.) is a critical component of the linked tectonic system that includes the Ironton fault. The fault plane connects the Bay de Chene and Lake Washington salt domes at the western and eastern ends of the fault plane respectively. It is probable that the domes and the fault have interacted throughout the Cenozoic Era, and that halokenesis and salt dissolution have played a causal role in fault slip events. Expansion index evaluation across the fault indicates continual episodic movement of the fault throughout the Pleistocene, but there is not adequate data to determine the vertical offset at the top of the Pleistocene. A boring profile from Frazier (1967) crosses the fault near its western edge. Frazier interpreted the sedimentary layers associated with the Bayou des Families (#7), Bayou Blue (#10) and early Mississippi (#13) deltas. The vertical trace of the fault has been superimposed on the profile to highlight the offset of the sedimentary layers across the fault. It is likely that each of the Holocene deltas defined by Frazier interacted with the components of the linked tectonic system, and that the architecture of each delta lobe reflects its interaction with the structural system. As will be discussed in a subsequent section, there is good evidence that sedimentary loading associated with the Miocene deltas that were active across this area caused accelerated slip on certain faults. It is probable that the deposition of deltaic sediments in the Holocene also contributed to fault slip events, and fault slip probably played an important role in the submergence of the delta lobes. The same depth interval associated with the Bayou des Families delta on the boring profile in Fig. 15 can be seen in the CPT profile in Fig. 9, and it appears that this interval has been offset by the Ironton fault.

The Montegut fault (Fig 16.) is along a trend of faults that extend westward from the Barataria fault that Gagliano et al (2003) called the Golden Meadow fault trend. The fault is one of several faults that were mapped in the subsurface with 3-D seismic data and extrapolated to surface traces that coincide with lineations in the marsh (Culpepper et al, 2019). Gagliano et al (2003) used a boring profile to document thicker peat accumulations on the hanging wall side of the fault, and related the fault to a lineation in the marsh surface and an area of dead cypress trees. Keucher et al (2001) identified a distinct anomaly in total dissolved solids in the soils adjacent to the fault. It is likely that saline fluid migration along the fault plane is associated with the soil salinity anomaly, and may have contributed to the death of the cypress trees.
The Bastian Bay fault (Fig. 17) parallels the Empire fault (Fig. 18), and both extend from the eastern flank of the Lake Washington salt dome. The fault plane has been mapped in the subsurface with well logs and 3-D seismic data, and it can be extrapolated to a surface trace that coincides with a distinct lineation in the marsh. A profile of well log correlations across the fault shows increasing fault throw with depth throughout the Pleistocene, and a vertical displacement at the top of the Pleistocene can be reasonably estimated at about 40 feet. Martin (2006) also documented expansion indices across the fault in the same depth range that indicate continual fault movement. The magnitude of the vertical offset at the top of the Pleistocene also suggests that it may be the result of larger and/or more frequent fault slip events that those previously discussed here. The nature of one of these events may be revealed in a comparison of the marsh surface across the area in images from ProPublica (2014). In the period between 1973 and 1975 a large area across the hanging wall of the Bastian Bay fault submerged and converted from mostly saline marsh to open water. Gagliano et al (2003) estimated that the vertical displacement on the fault at the surface was 3.0 to 3.5 feet, and reported anecdotal evidence from oyster fishermen and camp owners.

This pattern of rapid subsidence across a large area would be consistent with a fault slip event, but it may be possible that the “event” lasted for several weeks or months. In this type of scenario the entire magnitude of the fault slip would not be contained in a single catastrophic slip event, but it may have distributed over time as a series of smaller slip events or an extended period in which the rate of a continuous slow-slip motion was accelerated. Much more investigation is needed to understand the potential for this type of fault movement in the delta plain environment, but it should be considered in an evaluation of the Ironton fault.
The Empire fault (fig 18) was named by Gagliano et al (2003). The same fault has also recently been referred to as the Adams Bay fault, but the original name is used here to avoid confusion. The Empire fault is parallel to and just north of the Bastian Bay fault. The Empire fault plane has been mapped in the subsurface with well logs and 3-D seismic data, and it can be extrapolated to one of the most distinct surface escarpments on the delta plain. Expansion indices across the fault indicate continual movement throughout the Pleistocene (Martin, 2006) Gagliano et al (2003) constructed an auger boring profile across the fault to illustrate a vertical offset across the fault of 3.0 to 3.5 feet at the surface. Martin (2006) also quoted anecdotal evidence from Greg Linscombe of the Louisiana Department of Wildlife and Fisheries that the marsh break associated with the fault escarpment formed between 1976 and 1977. The magnitude and pattern of this fault slip event are similar to that associated with the Bastian Bay fault, but they appear to be separated in time by 3 or 4 years. The relationship between these two apparent fault slip events may provide insights into the nature of the connection between elements in the linked tectonic system. It may be possible that the Bastian Bay fault slip event changed the stress fields in the near-surface in a way that affected and contributed to the cause of the Empire fault slip event. Much more work is needed to understand these relationships, but the possibility for other components of the linked tectonic system to affect the Ironton fault should be considered in the evaluation.


The Magnolia fault (Fig. 19) appears to be linked to the Ironton fault through a connection with the Lake Hermitage salt dome. The Magnolia faults extends out of the eastern flank of the dome toward the Potash salt dome, but it not clear if it connects directly to the Potash dome from available data coverage. The plane of the Magnolia fault has been mapped with well logs and 3-D seismic data (Bullock et al, 2018) and the fault plane has been extrapolated to a surface trace which coincides with a fairly distinct lineation in the marsh. Bullock et al (2018) used a sediment core profile to illustrate the near surface offset of the fault and increased thickness of sedimentary layers on the hanging wall side of the fault. The upper layer of accumulated peat is thicker on the hanging wall of the fault, and higher average subsidence rates over about the last 1,000 years have also been interpreted by the incorporation of carbon dating of the organic sediments.
The surface trace of the Magnolia fault crosses the Lake Hermitage Marsh Creation Project. A reasonable peat thickness map can be constructed from the geotech cores from this project and cores taken by Bullock et al (2018). Peat thickness is greater on the hanging wall side of the fault, and it is likely that this reflects a cause and effect relationship with fault-induced subsidence. This configuration also provides valuable insights into the effect of sediment loading across the fault, as emplaced fill from marsh creation project extends across portions of the footwall and hanging wall sides of the fault. Simoneaux et al (2016) reported that “the magnitude of lateral displacement of these soft organic soils after fill material placement (aka ‘mudwaving’) was grossly underestimated.” It is not clear if lateral displacement of organic soils was greater on the hanging wall side of the fault, but that would be a reasonable assumption given the evidence of their thickness. This phenomenon should be further investigated, and some effort should be made to evaluate the potential for the lateral displacement of thick deposits of highly organic soils in the vicinity of the MBSD Project the as a result of mineral sediment deposited by the MBSD Project. This will be discussed in more detail in a subsequent section.
Subregional geological structure
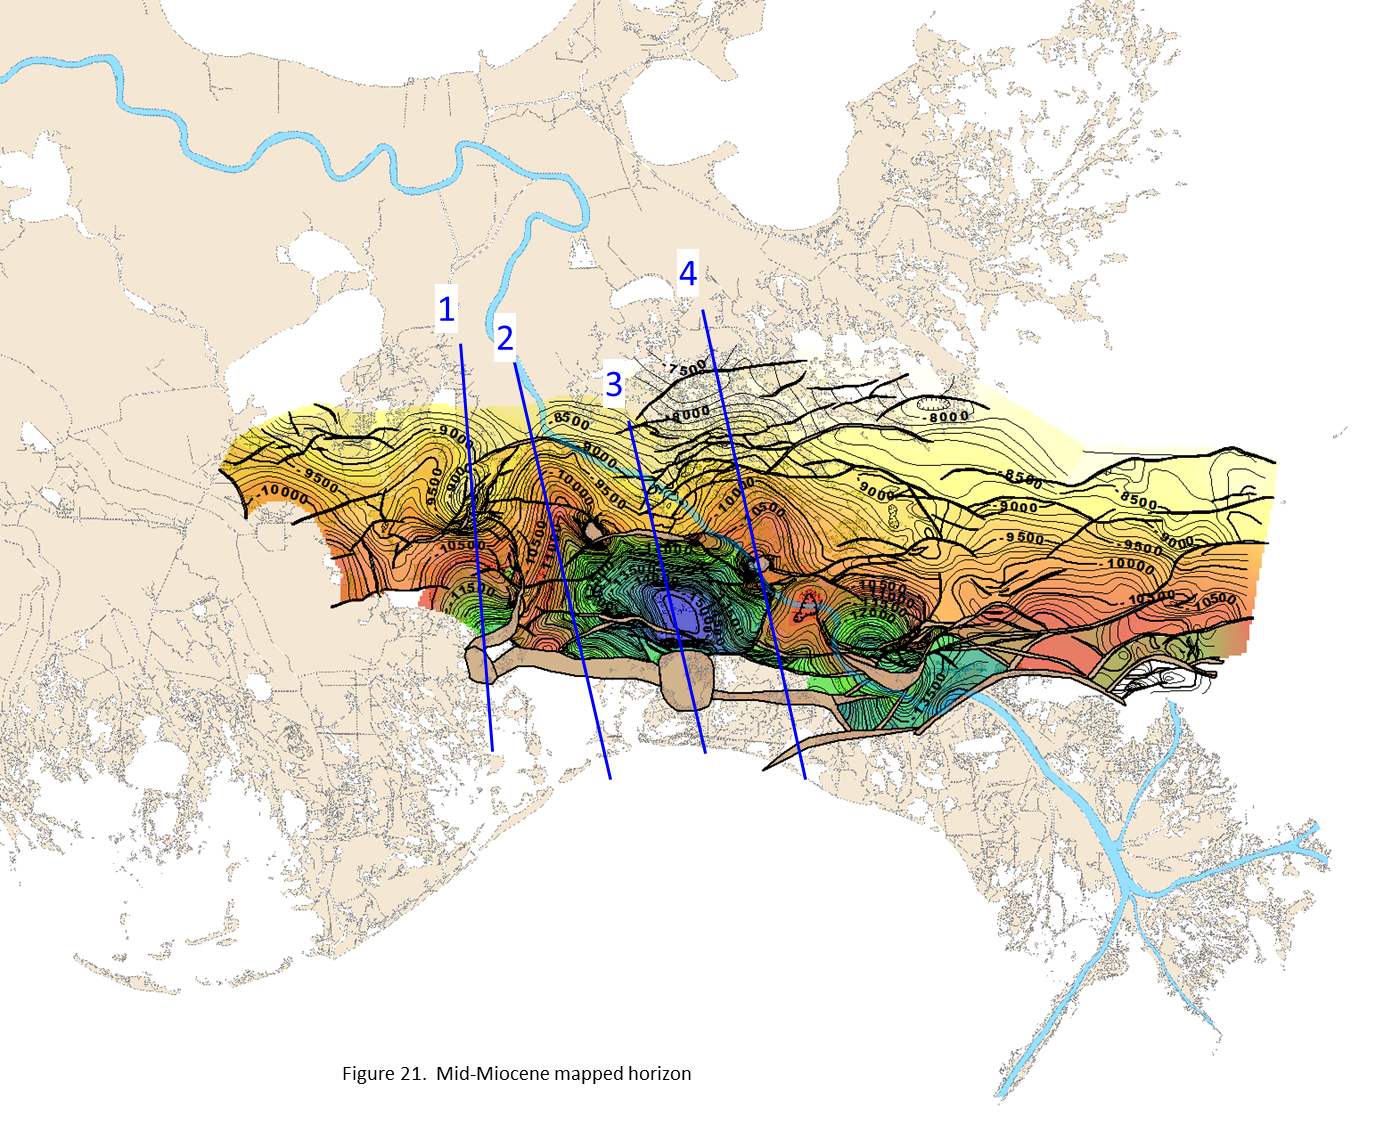
To meet the objective of providing insights into the historical relationships between sediment loading, fault slip events, and fault-induced subsidence that may be incorporated into predictive models for land elevation and land area gain in the MBSD project area, this evaluation will review the sub-regional geological structure in the vicinity of the project area. It will also examine the interactions between the structural system and four major Miocene delta systems. Fig. 20 shows an expanded scope of the linked tectonic system around the MBSD project area with a map of fault plane contours in yellow and salt dome contours in green. The contours are not labeled, but the contour interval is 1,000’ feet, and each of the faults extends to the surface with a 0’-depth contour. Figs. 21-23 show the extent of the mapped horizons at the Mid-Miocene, Pliocene and Pleistocene respectively. The Pleistocene map as derived from subsurface depth contours on the maps in the Coastal Plain section of the USACE Engineering Geology Mapping website. Faults that appear to reach the surface were integrated with the contours, and the contours were adjusted to reflect reasonable amounts of throw at the depth of the Pleistocene. Four sub-regional profiles are indicated on each map. These profiles are shown in block diagram form in Figs. 24-27.


Profile 1 crosses the Lafitte and Bay de Chene salt domes at the western ends of the Ironton and Barataria faults. The profile is just west of the surface trace of the Ironton fault, and the fault can be seen on the profile extending up from an intersection with the Lafitte salt dome, but not reaching the Pliocene mapped horizon. The salt domes exhibit a pattern that reflects a history in which they were probably squeezed up from an original Jurassic layer of salt under the weight of late Cretaceous and Paleogene sediments. Their tilted alignment may also suggest some association with down to the north faults that are related to “toe structures” that are antithetic to the Baton Rouge fault system.
The Lafitte graben is expressed above the top of the salt dome. “Graben” is derived from the German word for grave, and it refers to the down-dropped area between sets of opposing faults. Movement on these faults is directly associated with halokenetic movement on the salt dome. The fact that these faults appear to extend to the surface suggests some degree of geologically recent salt movement. Profile 1 very closely coincides with the boring profile constructed by Frazier (1967). The inset in the upper left corner of Fig. 24 shows the boring profile with the interior faults of the Lafitte graben superimposed. The black layer at the top of the graben indicates accumulated peat within the graben. This would further suggest recent fault movement and related subsidence at the Lafitte graben.
The profile also shows the dramatically expanded upper Miocene section on the hanging wall of the Barataria fault. This is reflected in the expansion index graph for the fault in Fig. 31.

Profile 2 crosses near the center of the Ironton and Barataria Bay fault planes. It clearly shows the listric nature of the faults. With the ability to seismically image below the 20,000’ depth of the profile, it would be possible to see the deeper extents of these fault planes. It is likely that the faults would continue to flatten and to eventually merge into a nearly horizontal glide plane or decollment surface, as suggested by the dashed lines. This probable deep connection between the faults is another aspect of the linked tectonic system that is not presented in the maps and profiles of this evaluation. Dokka et al (2006) referred to this configuration as the “southeast Louisiana allochthon”, an extensional complex driven by gravity instabilities. They used GPS data to assign rates of vertical and lateral motion associated with movement on this tectonic system. (Also see Karegar et al (2015), Fig. 33)

Profile 3 crosses the Magnolia fault and the Lake Washington salt dome. Lake Washington exhibits a pattern that suggests a strong component of lateral movement through the middle Miocene followed by a period of vertical diapiric movement. The top of the dome is at a depth of about 2,000’ and it intersects the Pliocene mapped horizon. There appears to be a genetic relationship between the Lake Washington salt dome and the Magnolia fault. Expansion on the fault appears to be greatest in the middle Miocene. The thickness of the upper Miocene increases into the center of structural syncline that is probably related to salt withdrawal in the early stages of vertical diapiric movement on the dome. The extent of this syncline can be seen in map view on Fig. 21. It is probable that the downward movement of the syncline due to salt withdrawal would have contributed to movement on the Magnoila fault throughout the upper Miocene and Pliocene.
Throughout the Cenozoic Era the faults moved in response to sedimentary loading. Some of the smaller faults on the profile that were active in the upper and middle Miocene ceased their movement, and became covered with enough sedimentary overburden to prevent future movement. The major faults continued to move episodically throughout the span of geological time, which has allowed them to propagate to the surface. It is likely that, if properly imaged, these faults would exhibit evidence of movement in the recent geologic past and in the historical past over the last few centuries. It is more probable that these faults are still capable of active movement in the present, than they that they lost that capability sometime in the recent past.

Profile 4 crosses the Delacroix Island fault, the Potash salt dome, the Empire fault and the Bastian Bay fault. Interval thickening across the fault is greatest in the middle Miocene at Delacroix Island and upper Miocene at Bastian Bay. The Bastian Bay fault also significantly expands the Pliocene interval. As will be discussed in the next section, the changes in expansion index for any of these faults can be related to their relationships with the active deltas that prograded across southeast Louisiana in the Miocene. There is a very clear relationship between sediment loading during active deltaic deposition and the magnitude of fault movement. Insights from these relationships could be used to formulate a predictive framework to assess the impacts of sediment loading at the MBSD Project.
Fault-Delta Interactions
Curtis (1970) provided detailed delineations of the Miocene delta systems of southeast Louisiana and a generalized conception about their relationships with faults that were active on the continental margin at the time. The general pattern over the period of several million years was a progressive advancement of the continental shelf edge to the south. Delta systems tended to cluster into phases, and each phase had a relationship with a different set of faults. Fig. 28 from Curtis (1970) begins with the advancement of deltas of the Mid-Miocene transgressive phase. The block diagram on the right shows the engagement of the delta systems with a theoretical fault system in the center of the block. Mid-Miocene regressive phase deltas fully engaged with this fault system, and deltaic sediments are thicker on the hanging wall side of the fault. Fault activity is implicitly caused by sedimentary loading from the delta, and fault-induced subsidence creates accommodation space that allows for the accumulation of more sediment. Deltas in the Late Miocene regressive phase prograded beyond the area of influence of the fault system, and engaged with another fault system further to the south and more capable of accepting the sedimentary load. Through this process each fault system has an expansion index that reflects its engagement with a delta system of a certain age.

Six faults in the vicinity of the MBSD Project are evaluated here to consider the relationships between sedimentary loading associated with Miocene deltas and fault movement. Each of these faults labeled in Fig. 29 is a major fault that is considered to be a part of a linked tectonic system with other faults and salt domes. Each fault has been active since at least the middle Miocene, and all appear to extend to the surface and show some evidence of activity in the recent past. Fig. 29 represents a generalized map of fault traces and salt domes in the subsurface. It is not intended to represent any particular subsurface stratigraphic horizon, but it is a representation of an approximate location of the fault trace at a depth of about 10,000 feet. The map is a compilation of interpretations from numerous sources. It is primarily intended to provide more detail than fault maps currently available in the technical literature, such as

Wallace (1962). The exact location of faults in the subsurface should be determined from horizon structure maps, such as those in Figs. 21 and 22. This generalized representation is accurate enough to be used in comparison to the paleogeographic reconstructions in Figs. 30-32. Expansion index graphs for each fault were constructed in exactly the same manner as that for the Ironton fault in Fig. 4. On each graph in the succeeding figures age in million years before present is on the vertical axis and expansion index is on the horizontal axis.

The Delta Farms, Ironton and Delacroix Island faults align with the boundary between the continental shelf and the upper continental slope in middle Miocene between 12 and 13 million years before present. The time interval is highlighted in yellow on the stratigraphic chart in the upper right and on each of the expansion index graphs. These shelf edge faults are an integral part of the paleogeographic reconstruction. The outlines of the active delta systems are derived from Curtis (1970) by relating the transgressive-regressive sequences to global sea level cycles. Eustatic curves for global sea levels were not established at the time of the publication of Curtis (1970), but the patterns of the transgressive-regressive cycles used at the time can be correlated to the eustatic curves with reasonable accuracy. A regional interval isopach (thickness) map for the same stratigraphic interval reveals two discrete depositional centers in which deltaic deposits of that age are measurably thicker than in surrounding areas. A generalized cross section across any of these faults at the time of deposition would be similar to the center block diagram in Fig. 28.
The expansion index graph for each fault reveals maximum expansion on the fault during this time interval. The faults are most active at the time of depositional loading, and fault-induced subsidence provides the accommodation capacity that keeps the delta engaged with the tectonic system during the span of deposition. These relationships underscore the observation that faults are as much a part of a delta system as the channels and sand bars. Fault movement caused by depositional loading should be an expected response in an active delta environment.

Fig. 31 shows the paleogeographic reconstruction for the end of the middle Miocene between 10 and 12 million years before present. The shelf edge and the active delta complexes have prograded to the south and the active depositional centers have shifted to another set of faults that include the Barataria and Magnolia faults. The expansion index graphs on these faults indicate maximum fault movement during this time interval. The graphs in Fig. 30 exhibit expansion indices greater than 1 during this time period This indicates that those faults also interacted with delta systems of this time, but with significantly lower magnitudes of fault activity.

The paleogeographic reconstruction for the upper (or late) Miocene in Fig. 32 shows the major depositional centers positioned along the northern boundary of the Terrebonne Trough. The Trough is defined by the alinement of down to the south faults along its northern boundary (including the Barataria and Bastian Bay and Montegut faults), and down to the north faults and salt domes along its southern boundary. The accommodation capacity of this structural system kept the major delta systems engaged throughout the remainder of the Miocene and into the Pliocene. The magnitude of accumulation of relatively thick and dense sedimentary layers within this basin created a regional density anomaly that is obvious on maps of the Earth’s gravitational field. The density differential across the area has been a contributing factor to fault movement and subsidence since the end of the Miocene.
Framework assessments for fault slip and subsidence rate models
The objectives of this evaluation are to provide a framework for predictive models for the magnitude and frequency of fault slip events and the relationships between fault slip, subsidence, elevation and land gain associated with the MBSD Project. This type of framework can now be considered in the context of the characteristics other faults presented here. The Ironton fault is a part of a linked tectonic system which allows for comparison with other faults in the system to help derive some preliminary values for the magnitude and frequency of fault slip, the rates of subsidence associated with the fault, and the probable response of loading sediment across the fault. The principal metric that allows for comparison among the faults is the throw of the fault at the top of the Pleistocene horizon. This value is estimated to be 6 feet on the Ironton fault based on the interpretation of the Conveyance Structure CPT profile presented here in Fig. 9. The value of throw at this horizon on other faults in the area established here is 3 feet on the Vacherie fault (Fig. 11), about 20 feet on the Gentilly fault (Fig. 14), and about 40 feet on the Bastian Bay fault (Fig. 17). Fisk (1944) documented a recent slip event on the Vacherie fault with 8 inches of vertical displacement, and Gagliano provided evidence for a recent slip event on the Bastian Bay fault of 3.0 to 3.5 feet of vertical displacement.
The intention of the recommendations made in McLindon et al (2017) was to collect the data necessary to evaluate the potential for fault slip in the vicinity of the MBSD Project. In the absence of the data necessary to fully develop a probabilistic model for future fault slip events, the values provided in this evaluation can be used to make some framework estimates. The expansion index graph on the Ironton fault in Fig. 5 gives some insight into the historical distribution of fault slip events. If the full historical distribution could be known, it would be very likely to exhibit a log-normal pattern for the magnitude of the events. This would mean that the distribution would consist of very many small events and very few large events. This type of size distribution is commonly associated with magnitude of earthquakes, which are the result of fault slip events in tectonic regions. The 6 feet of vertical offset at the top of Pleistocene on the Ironton fault is the cumulative offset of all slip events that have occurred since the beginning of Holocene deposition in the area. Frazier (1967) dated the basal transgressive deposit on the top of the Pleistocene in St. Bernard Parish at about 7,000 years before present. The orange sandy layer on the CPT profile in Fig. 9 is likely to represent a similar basal transgressive unit, and it is reasonable to assume that it has a similar age. This would mean that 6 feet of vertical offset has occurred over the last 7,000 years. If fault slip events occurred an average of once every century over that time span, then there would have been 70 discrete events with an average magnitude of about 1 inch of offset. If the magnitude of the slip events were log-normally distributed, as should be expected, then the distribution would reflect many small events of perhaps a fraction of an inch of offset and a few large events with magnitudes of possibly 1 foot of offset or more. This type of distribution would be consistent with the implications of the relationships between slip events on the Vacherie fault and crevasses of the river at the site of the fault (Fisk, 1944). Given that 8 inches of vertical offset in 1943 was not adequate to crevasse the river, it is reasonable to assume that a larger magnitude event would have been required, which would support a high-end value of about 1 foot vertical displacement at Ironton.
These framework estimates indicate that if a probabilistic distribution for future slip events were developed, it would include a non-zero value for the probability of the occurrence of a slip event on the Ironton fault during the time span of the MBSD project, and a smaller, but still non-zero value for the occurrence of an event with a magnitude of 1 foot of vertical offset. The acquisition of high resolution seismic data and high resolution dating of sediment cores across the fault should contribute to a significant improvement in the development of probabilistic models, and the recommendations of McLindon et al (2017) are reiterated here.
Estimates for subsidence rate models for the vicinity of the MBSD Project can be derived from observations about the relationships between subsidence rates, the thickness of the Holocene interval, and the organic content of the Holocene sediments in the areas examined here. The depth to the top of the Pleistocene (or the thickness of the Holocene) can be estimated at each of the faults examined here. The organic content of the soils has been estimated by the thickness of accumulated peat at the Gentilly fault, the Montegut fault and the Magnolia fault. A fairly detailed map of the thickness of accumulated peat and organic clays has been made with data from geotech cores taken for the MBSD Project and the Bayou Dupont Marsh Creation Project (Fig. 35). Byrnes et al (2019a & 2019b) found a “compelling relationship between subsidence and the age, composition and thickness of Holocene deltaic deposits” in the Breton and Barataria hydrologic basins, which includes the MBSD Project area. An estimate of total Holocene thickness could be derived from the top of Pleistocene map (Fig. 23), however the Holocene “topstratum” contains the more highly organic and compactable sediments of the Holocene and the topstratum isopach map (Kulp, 2000) is more informative in evaluating subsidence.

Fig. 33 combines Holocene topstratum thickness contours from Kulp (2000) with measurements of horizontal and vertical (subsidence) velocities from Karegar et al (2015) and surface fault traces where blue are down to the south faults and red are down to the north faults. Land motion velocities are measured at stations in the Continuously Operating Reference System using GPS technology. The relationship between the values of vertical velocities measured at these stations and the thickness of the Holocene is obvious. The three stations with subsidence values near 7 mm/yr lie along the axis of the Terrebonne Trough which coincides with the axis of thick Holocene sediments. Karegar et al (2015) also found that the horizontal vectors of land motion “may reflect slow downslope movement on a series of listric normal faults due to gravitational sliding”. Some consideration should be given to the potential impacts of horizontal land motion due to movement on the Ironton fault on the MBSD Project.

A patchwork compilation of interpretations by Gould & Morgan (1962), Kosters (1989) and in this evaluation using geotech cores from the MBSD Project, the Bayou Dupont Marsh Creation Project, and the Lake Hermitage Marsh Creation Project in Fig. 34 provides insight into the probable thickness distribution of highly organic soils across the rest of the area. There is a general tendency for thicker peats to accumulate off the natural levee flanks of distributary channels and on the hanging wall of faults that appear to extend to the surface. Keucher et al (2001) indicated that the consolidation of highly organic and clay rich-facies in recent delta deposits is a primary component of subsidence. Zou et al (2015) measured a subsidence rate anomaly from geodetic data that coincided with the thick peats between the natural levees of the Mississippi River and the Bayou Sauvage distributary channel and on the hanging wall of the Gentilly fault. Maximum values of subsidence in this area were over 15 mm/yr. Dixon et al (2006) documented similar values in the same area using InSAR technology. A closer examination of peat thickness in the vicinity of the MBSD Project in Fig. 35 shows thickness contours constructed from measurements of thickness of the upper layer of organic clay and peat in geotech cores. The pattern of the contours conforms to the general concept of thick peats accumulating off the natural levee flanks of distributary channels (taken from maps on the USACE Engineering Geology Mapping website) and on the hanging wall of a fault.

Thick peats have accumulated between the distributary channels Cheniere Traverse Bayou to the north Bayou Dupont in the middle and Bayou des Families to the southwest and the hanging walls of the Ironton fault and in the Lafitte graben. There are no direct measurements of subsidence in these areas. Predictive modeling of elevation and land gain for the MBSD Project should allow for subsidence rate values as high as 15 mm/yr above the areas of thick accumulations of organic clay and peat based on the analogy with the Gentilly fault area. Some qualitative insights into the patterns of subsidence in this area can be gained from the patterns of wetlands loss shown in Fig. 36. Reconstructions of what the marsh surface looked like in 1956 and 2009 from ProPublica (2014) indicate areas of wetlands loss due to subsidence in relationship to the thick peat accumulations. The compelling correlation suggests that compaction of the upper layer of organic clays and peats is the primary mechanism of subsidence. It is probable that the episodic slip events on the faults has contributed to historical subsidence that allowed for the thicker accumulation of peat on the hanging wall of the fault, but the contribution of fault slip to the current subsidence rate is unknown. Predictive modeling for the MBSD Project should provide for an accelerated rate of compaction of the upper organic soils in response to the deposition of mineral sediment caused by the MBSD Project, which is currently in the models described in the Draft EIS (indicated by the red outline on Fig. 35). The models should also allow for lateral displacement of the soft organic soils (mudwaving) in response to

sediment accumulation based on analogous configurations of a fault and thick peats at the Lake Hermitage Marsh Creation Project (Fig. 19).
The profile in Fig. 36 is constructed from geotech cores from the MBSD Project and the Bayou Dupont Marsh Creation Project it shows the thickening of the organic clay and peat across the Ironton fault. The thick accumulation of highly organic soils on the hanging wall is very similar to the pattern at the Gentilly fault.

Morton et al (2009) concluded that the extraction of oil and gas from the Lafitte Field has been the primary cause of subsidence over the last few decades in the vicinity of the MBSD Project. They provided no discussion of a causal process by which fluid extraction at the field would have induced subsidence, nor did they provide any evidence that the conditions necessary for such a process existed at the field. Although never stated in Morton et al (2009), the implicit mechanism for extraction-induced subsidence at the field was compaction of the produced reservoirs caused by the change in volume due to the extraction of fluids. Chan and Zobak (2007) documented that the magnitude of subsidence at the surface due to the extraction of fluids in the subsurface is a function of pressure change in the reservoir at depth. The reservoirs that they studied in Lapeyrouse Field in Terrebonne Parish had all experienced significant reductions in reservoir pressure due to the extraction of natural gas. Their calculations of reservoir compaction were based on the reduction in reservoir pressure. Their models showed that if reservoir compaction did occur, the expression of subsidence at the surface would be in the form of a bowl-shaped depression immediately above the reservoir.
The reservoirs at Lafitte Field are almost entirely oil reservoirs that are portions of very large saline aquifers. The oil is more buoyant than the saline pore fluid, and so oil accumulations tend to be in reservoirs around anticlinal structures, such as the Lafitte salt dome. The size of any individual reservoir is very small relative to the size of the entire aquifer. As oil is extracted from these reservoirs, the natural expansion of the aquifer is allowed by a slight compressibility of the pore fluids due to dissolved gases. The saline fluids naturally flow into the pore spaces from which oil has been extracted in a process called “water drive”. There is no significant change in pore pressure, nor is there any meaningful change in the volume of the aquifer. The submerged marshes in this area are well-removed from the produced reservoirs at Lafitte field. It is considered to be highly improbable that oil and gas extraction at Lafitte Field contributed to subsidence in the vicinity of the MBSD project. There is compelling evidence that subsidence in this vicinity is due primarily to the compaction of the upper layer of organic clays and peats.
Reiteration of Recommenations
McLindon et al (2017) recommended:
A review the subsurface geology using oil and gas industry 3-D seismic data. This may be accomplished through a collaborative engagement with owners, licensees and interpreters of the 3-D seismic surveys in the area. Such a collaborative engagement may be facilitated with the assistance of the New Orleans Geological Society, the Louisiana Mid-Continent Oil and Gas Association, or the Louisiana Oil and Gas Association.
The acquisition of high resolution seismic data in the immediate vicinity of the diversion structure. This should necessarily include land-based acquisition along both banks of the river and marine acquisition in the river channel, as indicated in Figure 6.
The acquisition of sediment core profiles across potential faults. The arrangement of these core profiles should be of adequate density to allow for the interpretation of faults by the vertical offset and variations in thickness of the sedimentary layers. The evaluation of core profiles should include detailed stratigraphic analysis and age-dating of the sedimentary layers to allow for estimates of historical subsidence rates and rates of fault movement.
The addition of subsidence measurement capabilities similar to those of the Myrtle Grove Superstation at several additional locations in the vicinity of the diversion. These stations should be positioned with advance knowledge of the location of faults in the area to allow for the direct measurement of variations in subsidence velocities across the faults.
The integration of detailed variations in subsidence rate and estimates of fault slip rate into predictive subsurface geological models including models for the response to sediment loading associated with diversion operations.
These recommendations are reiterated here and should be enhanced to insure that the acquisition of high resolution seismic data is based on survey design that provides for quality imaging to at least 200 feet and vertical resolution of at most a few feet. Sediment cores should be subjected optically stimulated luminescence and carbon dating techniques.
It is further recommended here that the Draft EIS should consider:
1. The potential impacts of an episode of fault slip on the MBSD Project infrastructure based on a predictive model for the magnitude and frequency of future episodes
2. The potential for accelerated rates of subsidence due to sedimentary loading associated with the MBSD Project,
3. The potential for an induced fault slip event due to sedimentary loading associated with the MBSD Project.
REFERENCES
Akintomide, A. O. and Dawers, N. H., 2019, Spatial and Temporal Variation of Fault Activity in the Terrebonne Salt Withdrawal Basin, Southeastern Louisiana: Response to Salt Evacuation and Sediment Loading, presentation, AAPG Annual Meeting, San Antonio, Texas.
Armstrong, C., Mohrig, D., Hess, T., George, T., Straub, K.M., 2014, Influence of growth faults on coastal fluvial systems: Examples from the late Miocene to Recent Mississippi River Delta, Sedimentary Geology, v. 301, p. 120-132
Bullock, J. S., Kulp, M. A., McLindon, C. D., 2018, Evaluation of the Magnolia growth fault, Plaquemines Parish, southeastern Louisiana, poster session, GSA Annual Meeting, Indianapolis, Indiana.
Byrnes, M. R., Britsch, L. D., Burlinghoff, J. L., Johnson, R., Khalil, S., 2019a, Recent Subsidence rates for Barataria Basin, Louisiana, Geo-Marine Letters, 14 p. doi.org/10.1007/s00367-019-00573-3.
Byrnes, M. R., Britsch, L. D., Burlinghoff, J. L., Johnson, R., Khalil, S., 2019b. Determining Recent Subsidence Rates for Breton Sound and Eastern Pontchartrain Basins, Louisiana: Implications for Engineering and Design of Coastal Restoration Projects. Final Report prepared for Louisiana Coastal Protection and Restoration Authority. Contract 4400009020, Task 8, 58 p.
Chan, A.W. & Zoback, M.D., 2007. The role of hydrocarbon production on land subsidence and fault reactivation in the Louisiana coastal zone. Journal of Coastal Research, 23(3), 771–786
Coastal Protection and Restoration Authority (CPRA), 2014a, Mid-Barataria Sediment Diversion - Final Draft Executive Summary Report 30% Basis of Design, State of Louisiana.
Culpepper, D.B., McDade, E. C., Dawers, N. H., Kulp, M. A., Zhang, R., 2019, Synthesis of Fault Traces in SE Louisiana Relative to Infrastructure, TranSET Project No. 17GTLSU12
Curtis, D. M., 1970, Miocene Deltaic Sedimentation, Louisiana Gulf Coast, S.E.M.P. Special Publication 15, Deltaic Sedimentation, Modern and Ancient, p. 293-308
Dixon, T.H., Amelung, F., Ferretti, A., Novali, F., Rocca, F., Dokka, R., Sella, G., Sang-Wan, K., Wdowinski, S., Whitman, D., 2006, Subsidence and flooding in New Orleans, Nature, v. 441, p. 587-588
Dokka, R. K., G. Sella, and T. H. Dixon, 2006, Tectonic control of subsidence and southward displacement of southeast Louisiana with respect to stable North America, Geophys. Res. Lett., 33, L23308, 5 p.
Dokka, R.K., 2011, The role of deep processes in late 20th century subsidence of New Orleans and coastal areas of southern Louisiana and Mississippi, Journal of Geophysical Research, v. 16, 25 pgs.
Fisk, H.N., 1944, Geological Investigation of the Alluvial Valley of the Lower Mississippi River, Mississippi River Commission.
Frank, J. P., 2017, Evidence of fault movement during the Holocene in Southern Louisiana: integrating 3-D seismic data with shallow high resolution seismic data, MS Thesis, University of New Orleans, 91 p.
Frazier, D.E., 1967, Recent deltaic deposits of the Mississippi River: their development and chronology, Trans. G.C.A.G.S., v. 17, p. 287‐315
Gagliano, S.M., Kemp III, E. B., Wicker, K. M., Wiltenmuth, K. S., 2003. Active Geological Faults and Land Change in Southeastern Louisiana. Prepared for U.S. Army Corps of Engineers, New Orleans District, Contract No. DACW 29-00-C-0034.
Gould, H. R. and Morgan, J.P., 1962 Coastal Swamps and Marshes, Geology of the Gulf Coast and Central Texas, p 287-341
Hopkins, M., Lopez, J., Songy, A. 2018, Subsidence rates from faulting determined by real-time kinematic (RTK) elevation surveys of bridges in Lake Pontchartrain, presentation, State of the Coast Conference 2018, New Orleans, Louisiana.
Johnston, A., Zhang, R., Gottardi, R., Dawers, N. H., 2017, Investigating the relationships between tectonics and land loss near Golden Meadow, Louisiana by utilizing 3-D seismic and well log data, poster session, GSA Annual Meeting, Seattle, Washington.
Karegar, M.A., Dixon, T.H., Malservisi, R., 2015, A three-dimensional surface velocity field for the Mississippi River Delta: Implications for coastal restoration and flood potential, Geology, v. 43, p. 519-522
Kosters, E. C., 1989, Organic-Clastic Facies Relationships and Chronostratigraphy of the Barataria Interlobe Basin, Mississippi Delta Plain, Journal of Sedimentary Petrology, v. 59, no. 1, p. 98-113
Kuecher, G.J., Roberts, H.H., Thompson, M.D. and Matthews, L., 2001, Evidence for Active Growth Faulting in the Terrebonne Delta Plain, South Louisiana: Implications for Wetland Loss and the Vertical Migration of Petroleum., Environmental Geosciences, v. 8, p. 77‐94
Kulp M. 2000. Holocene stratigraphy, history, and subsidence of the Mississippi River delta region, north-central Gulf of Mexico. PhD thesis. Univ. Kentucky, Lexington. 283 pp.
Levesh, J. L,, Kulp, M. A., McLindon, C. D., 2019, Fault-slip history of the Delacroix Island fault system and its effect on Holocene salt marshes of the Mississippi River delta plain, presentation, GSA Annual Meeting, Charleston, South Carolina
Lopez, J., Penland, S., Williams, J., 1997, Confirmation of Active Geologic Faults in Lake Pontchartrain in Southeast Louisiana, GCAGS Transactions, v. 47, p. 299-303
Martin, E., 2006, Fault Induced Subsidence Near Empire and Bastian Bay, Louisiana, MS Thesis, Tulane University, 163 p.
McLindon, C.D., 2017, History of fault slip and interaction with deltaic deposition from the middle Miocene to the Present – Barataria fault, coastal Louisiana, poster session, American Geophysical Union, annual meeting, New Orleans, Louisiana.
McLindon, C.D., Dawers, N.A., Culpepper, D., Kulp, M.A., and McDade, E., 2017, Comments to the U.S. Army Corps of Engineers, New Orleans Division in reference to the The Environmental Impact Statement for the Mid-Barataria Sediment Diversion. 11 pg.
Morton, R.A., Bernier, J.C., and Kelso, K.W., 2009, Recent subsidence and erosion at diverse wetland sites in the southeastern Mississippi delta plain: U.S. Geological Survey Open-File Report, 2009–1158, 39 p., plus app. (p. 41-221).
ProPublica, 2014, Losing Ground
Simoneaux, R., Richard, B., Cantu, K., and Roy K., 2016, The Impacts of In-Situ Soil Displacements on Settlement and Consolidation of Marsh Creation Fill – Lake Hermitage Marsh Creation, Abstract – State of the Coast Conference, New Orleans, LA
Wallace, W.E., 1962, Fault Map of South Louisiana (Scale 1:500,000), Gulf Coast Association of Geological Societies Transactions Vol. XII, p. 194.
Zou, L., Kent, J., Lam, N. S.-N., Cai, H., Qjang, Y., and Li, K., 2016, Evaluating Land Subsidence Rates and Their Implications for Land Loss in the Lower Mississippi River Basin, Water, v. 8, 15 p.


